
GoFly Graphs
This page contains important easy to use graphs to assist pilots, student pilots and flight instructors with key principles for all fixed wing flight theory. Each graph also contains explanations. You can print, download and share this information providing the GoFly Online Logo is displayed.

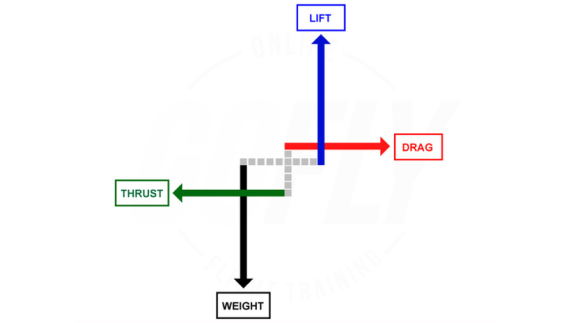
The Four Forces Graph
The Four Forces Graph depicts the four forces acting on an aircraft during flight. They are Lift, Weight, Thrust and Drag. It is important for all students to understand the relationship these forces have on the aircraft.


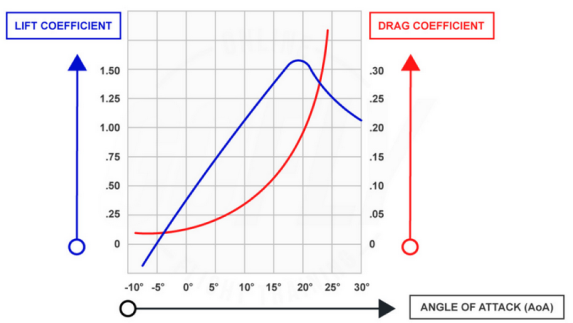
Lift and Drag Coefficient
This graph demonstrates the relationship between lift and drag and angle of attack of the aerofoil.
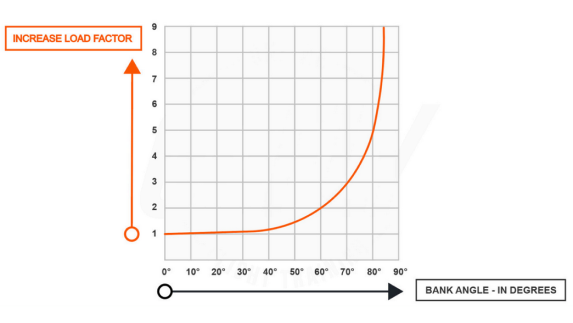
Load factor
This graph demonstrates the relationship between angle of bank and load factor.
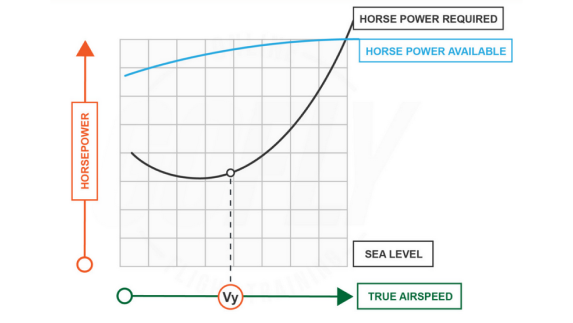
Power available at Sea Level
This graph demonstrates the relationship between power required versus power available and this changes with height. It also demonstrated that the largest difference between horse power required and horse power available at the VY speed or best rate of climb.
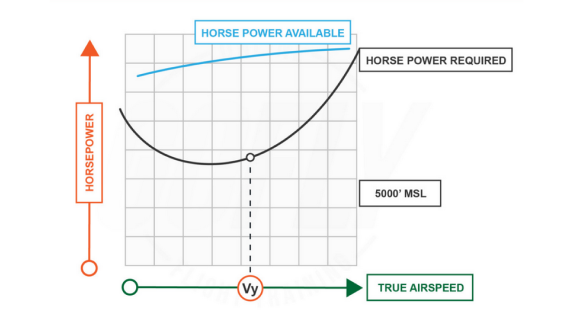
Power available at 5,000 feet
This graph demonstrates the relationship between power required, versus power available, and this changes with height. It also demonstrated that the largest difference between horse power required and horse power available at the VY speed or best rate of climb
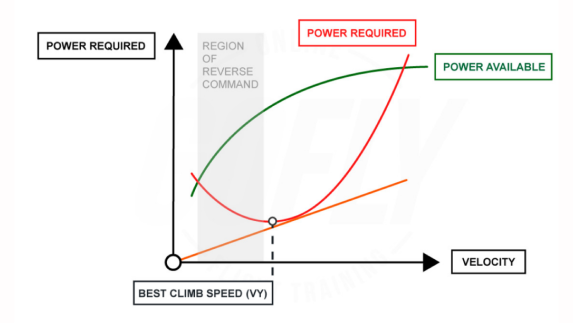
Best Climb Graph
Best Climb graph is similar to the Power available graph as it shows the relationship between power available and power required. It also shows the region of reverse command. The region of reverse command is also known as the back of the power curve. It is a dangerous slow speed region where any decrease in airspeed will see an increase in total drag and any increase in airspeed will see a decrease in total drag. This is the reverse of what happens in normal flight (cruise speed ).
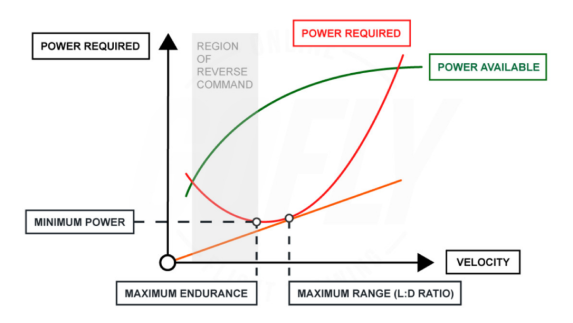
Max range graph
This graph is identical to the ‘best climb’ graph, however it shows the relationship between maximum endurance and maximum range. Maximal range is the maximum distance an aircraft can fly with the available fuel less reserves. The Maximum endurance is the amount of time an aircraft can stay in the air with the available fuel less reserves. The graph also demonstrates the relationship between the airspeed to power required to maintain both maximum range and endurance.
7 Day
FREE
Trial
Get access to the complete catalogue of your chosen subscription level for 7 days. After your free trial, your paid subscription automatically commences. Cancel anytime.
Get FREE TrialOur
Partners